
The outline report view presents the contents of reports with a focus on backtraces.
This view presents the exception type (and signal) and the diagnostics message available in the report.
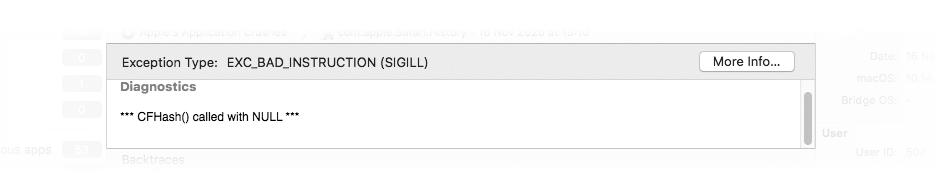
| Note: The view can be resized to only display the exception type. |
To display more information about the type of exception:
| 1 | Click the More Info… button. |
| 2 | Click "Open on Apple's Developer Site" if you want to know even more about the type of exception. |
The backtraces can be presented using a list or columns. It's up to you to choose the layout you want to use.
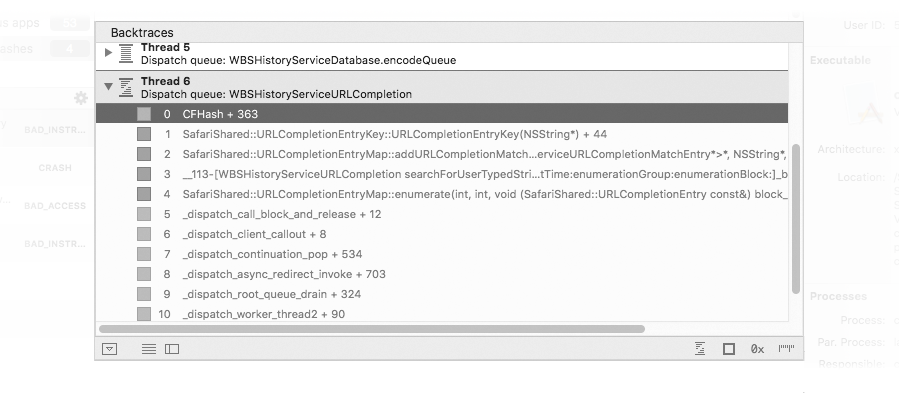

In addition to the usual stack frame components, the origin of the binary image for the machine instruction address of a stack frame is indicated by a colored icon. The colors are the same as the ones used in the Xcode debugger.
To copy a stack frame as it is displayed:
| 1 | Select the stack frame. |
| 2 | Choose Edit > Copy. |
To only copy the machine instruction address of stack frame:
| 1 | Control-click the stack frame. |
| 2 | Choose Copy Machine Instruction Address |
To copy the offset of a stack frame in the related binary image:
| 1 | Control-click the stack frame. |
| 2 | Hold down the alt key and choose Copy Binary Image Offset |
To show the machine instruction address in Hopper Disassembler:
| 1 | Control-click the stack frame. |
| 2 | Choose Show In > Hopper Disassembler. |
Notes:
|
The presentation options are available at the bottom of the Backtraces list.

The following layout options are available:
To show or hide the list of binary images:
| 1 | Click the binary images disclosure button or choose View > (Show|Hide) Binary Images. |
To switch between the list and column layouts:
| 1 | Click the outline layout toggle. |
To only display the backtrace of the crashed thread:
| 1 | Click the crashed thread toggle. |
Unexpectedly also lets you show or hide some components of the stack frame of a backtrace:
To hide or show the binary name of stack frames:
| 1 | Click the binary name toggle. |
To hide or show the machine instruction address of stack frames:
| 1 | Click the machine instruction address toggle. |
To hide or show the byte offset (and source file) of stack frames:
| 1 | Click the byte offset toggle. |
| See the Preferences chapter to learn how to define which components should be visible by default. |
This pane presents in a table all the binary images listed in the report.
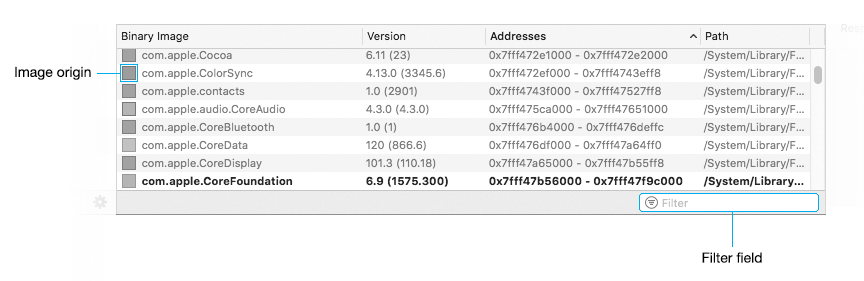
Here are the main features of the table:
To show a binary image in the Finder:
| 1 | Select the binary image in the list. |
| 2 | Choose File > Show in Finder. |
To open a binary image in Hopper Disassembler:
| 1 | Select the binary image in the list. |
| 2 | Control-click the binary image and choose Open With > Hopper Disassembler. |
Note:
This assumes that Hopper Disassembler is installed on your Mac.
|
To filter the displayed binary images:
| 1 | Click the Filter field. |
| 2 | Type the string to match. |
| Revision History | ||
|